Australian Registered Training Organisation
Client Profile
An Australian training college delivered vocational education and training programmes across business, information technology, community services, hospitality, and management disciplines. Courses were delivered through classroom, blended and online learning models.
The institution served domestic and international cohorts across multiple campuses.
Business Challenge
The college collected extensive information through its student-management system, learning-management platform, attendance tools, assessment records, admissions systems and finance applications. However, this data was not presented as a connected student lifecycle.
Management had limited visibility into:
- Enquiry and application conversion
- Student commencement and attendance
- Assessment progress
- At-risk students
- Course completion
- Trainer workload
- Student satisfaction
- Campus and programme performance
- Outstanding fees
- Withdrawals and deferrals
Reports were primarily retrospective. By the time low attendance or academic disengagement became visible, intervention opportunities were limited.
Visualization Solution
Admissions and Conversion Dashboard
This dashboard monitored the recruitment funnel from initial enquiry to confirmed commencement.
It included:
- Enquiries by source and programme
- Applications started and completed
- Offers issued
- Offer acceptance
- Enrolments confirmed
- Students commenced
- Conversion rate by stage
- Application-processing time
- Marketing source performance
- Campus and programme demand
Funnel visualizations identified where prospective students were leaving the admissions process.
Student Engagement Dashboard
The engagement dashboard combined:
- Attendance percentage
- Learning-platform logins
- Time spent in the learning environment
- Resource access
- Assessment submission behaviour
- Trainer interactions
- Support-service contacts
- Recent participation trends
A configurable risk model identified students showing multiple disengagement indicators. The dashboard supported early intervention but did not automatically label students without staff review.
Academic Progress Dashboard
Academic staff could review:
- Units commenced and completed
- Competent and not-yet-competent outcomes
- Assessments due
- Late submissions
- Reassessment frequency
- Course progression
- Expected versus actual completion
- Trainer and class-level outcome patterns
- Students requiring academic support
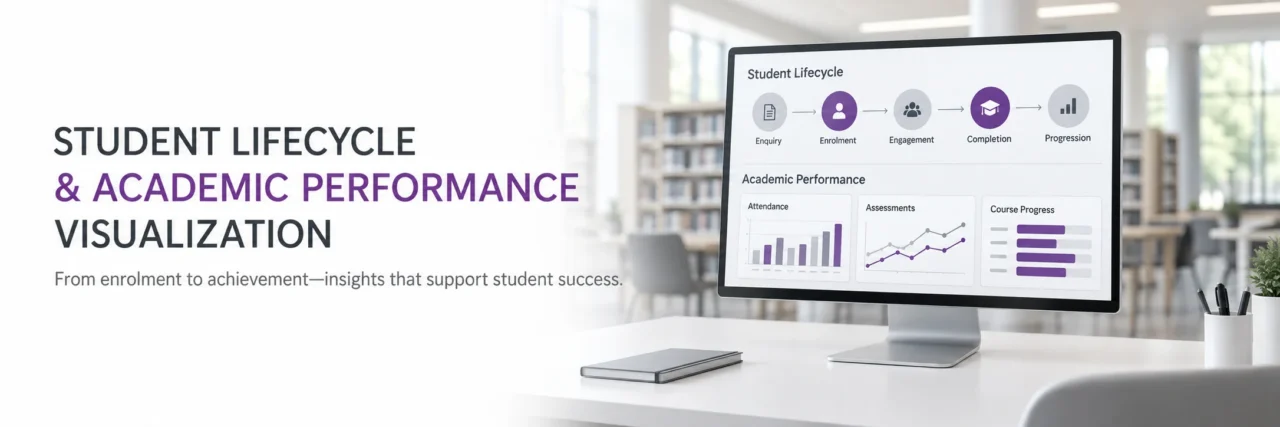
Cohort charts allowed managers to track how groups progressed over the duration of a qualification.
Student Retention Dashboard
Withdrawal and deferral patterns were analysed by:
- Programme
- Campus
- Delivery mode
- Intake
- Student category
- Study stage
- Attendance range
- Academic performance
- Withdrawal reason
The dashboard distinguished early withdrawals from students leaving near completion, enabling different intervention strategies.
Student Support Dashboard
The college could monitor:
- Students receiving support
- Type and frequency of support
- Open support cases
- Response and resolution time
- Repeat requests
- Referral pathways
- Intervention outcomes
- Satisfaction following support
Sensitive information was available only to authorised users.
KPI Framework
Key measures included:
- Enquiry-to-application conversion
- Offer-to-enrolment conversion
- Commencement rate
- Attendance rate
- Assessment submission rate
- Unit completion rate
- Course completion rate
- Withdrawal and deferral rate
- At-risk student population
- Intervention response time
- Student satisfaction
- Outstanding fee exposure
Illustrative Outcomes
The visualization solution enabled:
- Earlier identification of disengaged students
- More targeted academic and pastoral interventions
- Improved visibility into course and campus performance
- Better monitoring of enrolment conversion
- Reduced time spent compiling academic reports
- Stronger understanding of withdrawal patterns
- Better coordination between admissions, academics, finance, and student support
Strategic Value
The college moved from retrospective reporting to proactive student lifecycle management. Instead of waiting for withdrawal or failure outcomes, teams could recognize the combination of attendance, engagement, assessment, and support indicators that often appeared earlier.