
Australian Multi-Campus Vocational Training College
Client Profile
A vocational training provider delivered qualifications through several campuses, workplace-based programmes, online learning and employer-sponsored training. It worked with individual students, corporate clients, trainers, assessors, placement partners and education agents.
Rapid growth created challenges in maintaining consistent delivery quality and resource utilization.
Business Challenge
Management needed a reliable way to compare programmes and campuses without oversimplifying performance. Existing reporting could not adequately explain:
- Why some cohorts achieved better outcomes than others
- Whether trainer workloads were balanced
- Which units generated repeated reassessments
- Whether classrooms and laboratories were being used effectively
- Where practical placements were delayed
- Which corporate programmes were commercially sustainable
- Whether student feedback resulted in measurable action
- How trainer qualifications and professional development were being maintained
Data Visualization Strategy
The solution was structured around three management questions:
- Are learners receiving consistent, high-quality training?
- Are trainers and facilities being used effectively?
- Are programmes operationally and financially sustainable?
Data was consolidated from the student-management system, learning platform, trainer records, timetable system, placement tracker, survey platform and finance system.
Visualization Solution
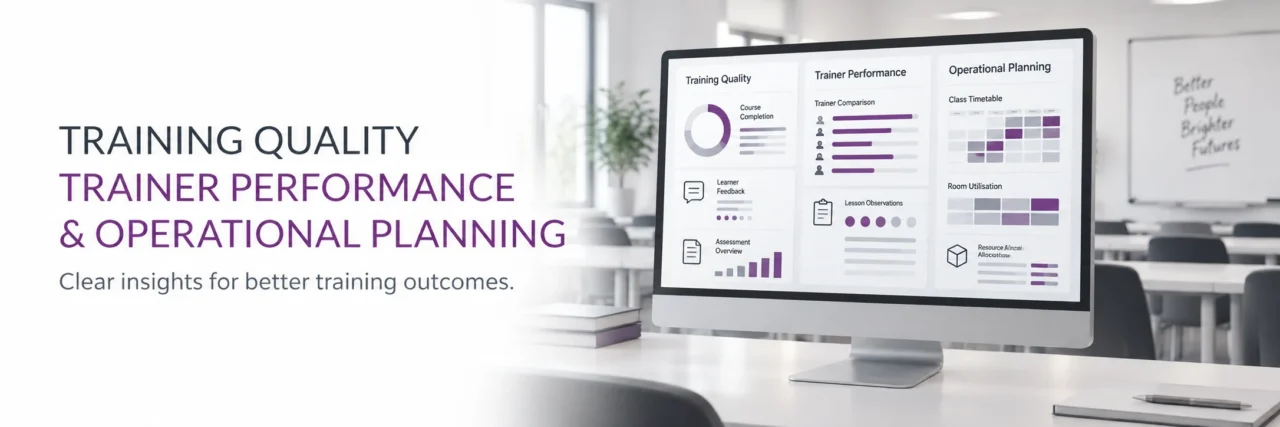
Training Quality Dashboard
The dashboard visualized:
- Completion and progression
- Assessment outcomes
- Reassessment rates
- Student feedback
- Complaints and appeals
- Trainer observation results
- Course-review actions
- Learning-resource issues
- Unit-level performance variation
Box plots and distribution charts showed the range of outcomes instead of relying only on averages. This helped identify inconsistent cohorts or units.
Trainer Performance and Capacity Dashboard
This view provided appropriate operational information without reducing trainer performance to a single ranking.
It included:
- Scheduled and delivered teaching hours
- Number and size of cohorts
- Assessment workload
- Assessment turnaround time
- Reassessment volumes
- Student feedback
- Professional development status
- Qualification and competency status
- Leave and availability
- Future workload projections
Performance discussions considered student mix, delivery mode, unit complexity, and cohort size.
Timetable and Facility Utilization Dashboard
Interactive heat maps showed:
- Classroom occupancy
- Computer-laboratory use
- Practical training-space utilization
- Peak and low-demand periods
- Scheduling conflicts
- Cancelled sessions
- Trainer availability
- Capacity for future intakes
Management could identify under utilized facilities and periods of excessive scheduling pressure.
Work Placement Dashboard
For programmes requiring practical placement, the dashboard tracked:
- Students requiring placement
- Placement-ready students
- Partner availability
- Confirmed placements
- Placement hours completed
- Expiring agreements
- Supervisor documentation
- Delayed placements
- Students approaching course completion without required hours
This prevented placement delays from remaining hidden until the end of a programme.
Corporate Training Dashboard
The corporate training view presented:
- Active employer programmes
- Learner attendance
- Programme completion
- Trainer allocation
- Delivery milestones
- Contract value
- Direct delivery cost
- Margin by programme
- Client satisfaction
- Renewal opportunities
Data Governance
A formal KPI dictionary was developed to define completion, withdrawal, attendance, trainer utilization, assessment turnaround and facility usage consistently.
The governance model included:
- Data ownership by functional area
- Scheduled data-quality checks
- Role-specific access
- Version-controlled KPI definitions
- Reconciliation with source systems
- Documented calculation logic
- Reporting-period controls
Illustrative Outcomes
The college achieved:
- Better visibility into trainer capacity and future requirements
- Earlier identification of placement bottlenecks
- Improved consistency in program reviews
- Better use of classrooms and practical facilities
- Identification of units with unusually high reassessment rates
- More informed decisions about intake scheduling
- Clearer evaluation of corporate training profitability
- Reduced dependence on manual spreadsheet reporting
Strategic Value
The visualization platform created a balanced view of academic quality, resource efficiency, learner experience, and commercial performance. It helped management expand program’s based on reliable evidence rather than enrollment volume alone.