Singapore Colocation Data Centre
Client Profile
A Singapore-based colocation data centre supported enterprise, cloud, telecommunications and digital-platform customers. The facility operated critical power and cooling infrastructure across multiple data halls with different rack densities and customer requirements.
Operational information was generated by building management systems, electrical power monitoring, DCIM tools, cooling systems, UPS equipment, PDUs, environmental sensors, service-management platforms and capacity spreadsheets.
Business Challenge
Although the data centre collected large volumes of operational data, teams lacked an integrated view of facility health, customer capacity, energy performance and emerging risks.
Management required improved visibility into:
- Facility and IT energy consumption
- Power Usage Effectiveness
- UPS, PDU and electrical-path loading
- Cooling performance
- Rack-level capacity
- Temperature and humidity conditions
- Alarm volumes and recurring events
- SLA performance
- Planned maintenance
- Customer capacity allocation
- Sustainability indicators
- Future capacity requirements
The principal challenge was turning high-frequency technical data into role-specific insights without overwhelming users with alarms and measurements.
Visualization Strategy
We developed a tiered monitoring and decision-support environment.
Each layer answered a different question:
- Executive: Is the facility efficient, resilient and commercially sustainable?
- Operations: Where is performance outside the expected range?
- Engineering: Which asset or condition is driving the deviation?
- Capacity planning: How much usable capacity remains and where?
- Customer management: Is committed capacity being delivered within agreed conditions?
Data Sources
The platform integrated:
- Data Centre Infrastructure Management systems
- Building Management Systems
- Electrical Power Monitoring Systems
- UPS and battery monitoring
- Static and intelligent PDUs
- Cooling-unit and chiller data
- Temperature, humidity and differential-pressure sensors
- Fire and water-leak detection
- IT service-management records
- Maintenance systems
- Customer capacity and contract records
- Utility billing and environmental reporting data
Visualization Solution
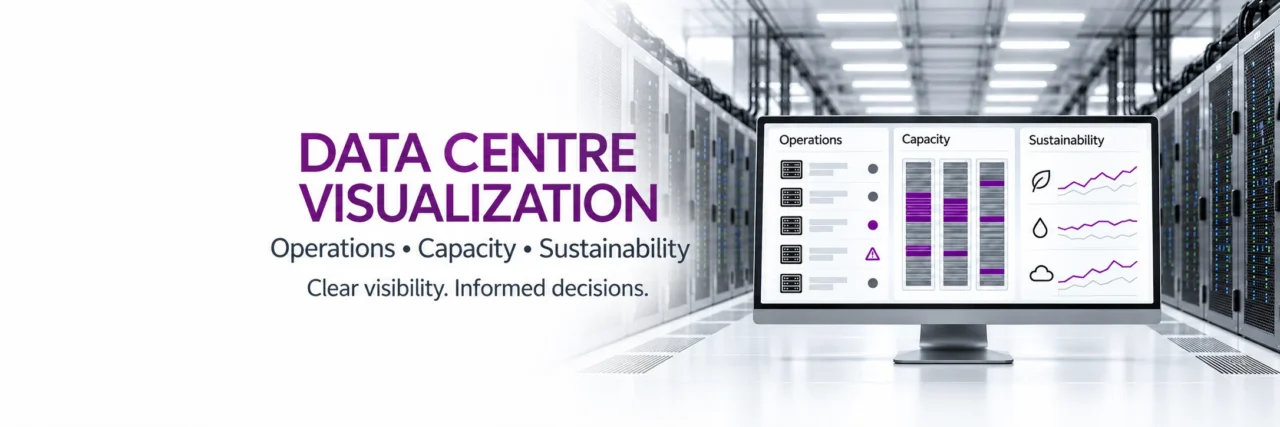
Executive Operations Dashboard
The executive dashboard displayed:
- Current IT load
- Facility energy consumption
- Power Usage Effectiveness
- Available and committed capacity
- Data hall occupancy
- Critical alarm status
- SLA performance
- Energy cost
- Carbon-related indicators
- Capacity forecast
- Maintenance risk
- Month-on-month efficiency trends
The dashboard intentionally limited operational detail, allowing leadership to identify significant movements and drill into their causes.
Electrical Infrastructure Dashboard
The electrical dashboard visualized the complete power chain.
It covered:
- Utility input
- Transformers and switchgear
- Generators
- UPS modules
- Battery systems
- PDUs
- Rack power
- Redundant power paths
- Phase loading
- Capacity headroom
- Load imbalance
- Threshold violations
Single-line visualizations helped engineers understand how load was distributed. Trend charts identified gradual load migration, and alerts highlighted conditions affecting redundancy or usable capacity.
Cooling Performance Dashboard
Cooling visualizations included:
- Supply and return air temperature
- Cooling-unit utilisation
- Chiller performance
- Cooling demand by data hall
- Temperature compliance
- Humidity conditions
- Differential pressure
- Hotspot frequency
- Cooling capacity headroom
- Energy consumption by cooling system
Thermal heat maps showed rack inlet conditions across data halls. Engineers could compare thermal patterns with rack power density and airflow conditions.
Rack Capacity Dashboard
A rack-level view connected:
- Allocated rack space
- Occupied rack units
- Contracted power
- Actual power consumption
- Network-port availability
- Weight restrictions
- Cooling capability
- Customer allocation
- Deployment reservations
This prevented capacity from being assessed using floor space alone. A rack might have physical space remaining but lack sufficient usable power, cooling, or connectivity.
Alarm and Incident Intelligence Dashboard
The platform consolidated alarms from multiple systems and classified them by:
- Severity
- Source
- Data hall
- Asset
- Duration
- Frequency
- Acknowledgement time
- Resolution time
- Recurrence
- Probable common cause
Alarm-flood analysis helped distinguish a primary event from numerous dependent alarms. Pareto charts showed the assets and conditions responsible for the largest proportion of recurring alerts.
Sustainability and Energy Dashboard
The sustainability view presented:
- Total energy consumption
- IT and non-IT energy usage
- Cooling energy
- Energy intensity
- Power Usage Effectiveness trends
- Renewable energy contribution
- Estimated emissions
- Water-related performance, where measured
- Performance by data hall
- Energy cost variance
- Efficiency improvement initiatives
Normalization was applied when comparing different reporting periods so that changes in IT load, weather conditions, occupancy, and operating profile could be considered.
Advanced Analytical Capabilities
Capacity Forecasting
Historical load growth, contracted capacity, deployment reservations, and planned customer onboarding were used to forecast:
- Data hall power demand
- Rack availability
- Cooling requirements
- UPS loading
- Capacity exhaustion dates
- Infrastructure expansion requirements
Anomaly Detection
Dynamic operating ranges were developed for selected assets. Alerts were generated when behaviour differed materially from expected patterns, even if a fixed alarm threshold had not yet been exceeded.
Root-Cause Exploration
Engineers could visually correlate:
- Increased rack density with local temperature changes
- Cooling energy with IT load
- Alarm events with maintenance activities
- UPS loading with customer deployments
- Temperature excursions with airflow or containment conditions
These relationships guided investigation; engineering teams retained responsibility for confirming actual causation.
Security and Operational Controls
The visualization platform incorporated:
- Role-based access
- Customer data segregation
- Secure system integration
- Read-only access to operational platforms
- Audit logging
- Data-retention controls
- Dashboard performance monitoring
- Asset naming and hierarchy standards
- Validation of sensor quality
- Resilience for critical reporting components
The analytics layer was kept separate from real-time control systems. It supported monitoring and decisions but did not directly alter critical infrastructure operating parameters.
Illustrative Outcomes
The data centre achieved:
- Faster identification of electrical and thermal constraints
- Better visibility into usable capacity at rack and data hall level
- Reduced manual consolidation of operational reports
- Improved tracking of recurring alarms
- More informed customer deployment planning
- Earlier identification of potential hotspots
- Better measurement of energy-efficiency initiatives
- Stronger executive visibility into operational and sustainability performance
- Improved collaboration between facility, engineering, commercial, and capacity-planning teams
Strategic Value
The solution transformed technical monitoring data into an integrated operational intelligence platform. The data centre could assess resilience, efficiency, capacity, customer commitments, and sustainability through a consistent visual framework.
Our Visualization Services Approach
Across all five case studies, the visualization programme follows a structured delivery model:
| Stage | Key Activities | Deliverable |
|---|---|---|
| Discovery | Stakeholder interviews, business-question identification and report review | Visualization requirements |
| Data Assessment | Source identification, quality profiling and access review | Data-readiness assessment |
| KPI Design | Metric definitions, ownership, thresholds and calculation rules | KPI dictionary |
| Information Architecture | Dashboard hierarchy, navigation and user-role design | Dashboard blueprint |
| Data Preparation | Integration, transformation, validation and reconciliation | Analytics-ready dataset |
| Visualization Development | Dashboard creation, filtering, alerts and drill-through | Interactive dashboards |
| Validation | Business, technical, security and user-acceptance testing | Approved solution |
| Deployment | Access configuration, refresh scheduling and user training | Production platform |
| Continuous Improvement | Usage monitoring, enhancement and KPI review | Evolving decision-support system |
Core Technology Capabilities
Our services can support visualization environments using platforms such as Microsoft Power BI, Tableau, Qlik, Looker, or other enterprise reporting technologies. The platform is selected according to the client’s data architecture, security requirements, licensing model, user base, and reporting maturity.
Our capabilities include:
- Executive and operational dashboards
- Real-time and scheduled reporting
- Mobile-responsive visualizations
- Geographic and heat-map analysis
- Forecasting and scenario visualization
- Role-based access
- Exception and threshold reporting
- Automated report distribution
- Drill-down and root-cause analysis
- KPI governance
- Embedded analytics
- Data-quality monitoring
Closing Positioning Statement
At Intris, we approach visualization as a management and operational capability—not merely as dashboard development. Our solutions are designed to present the right information, at the right level, to the right decision-maker.
By combining industry understanding, data governance, analytical design, and intuitive visual storytelling, we help organizations move from fragmented reporting to faster, evidence-based decision-making.