
Australian Residential Aged Care and Home Care Organization
Client Profile
An Australian care organization managed residential aged care facilities alongside home and community care operations. It employed registered nurses, personal care workers, allied health professionals, care coordinators, domestic support staff and administrative teams.
The organization faced increasing complexity in workforce deployment, mandatory training, care quality, occupancy, clinical monitoring and service-cost management.
Business Challenge
Information was distributed across clinical care systems, rostering platforms, payroll applications, learning-management systems, quality registers & facility spreadsheets.
Management could not easily determine:
- Whether staffing levels aligned with resident and client needs
- Which facilities were relying excessively on overtime or agency labour
- Whether mandatory training and credentials were current
- Where recurring clinical risks were developing
- How occupancy and care requirements affected workforce demand
- Whether quality actions were completed on time
- Which locations required management intervention
Static monthly reports were often available only after the opportunity for corrective action had passed.
Data Visualization Strategy
We designed a visual performance framework around four connected dimensions:
- Care quality
- Workforce readiness
- Operational performance
- Financial sustainability
The solution combined data from:
- Electronic care-management systems (Highly Confidential data)
- Medication and clinical observation records (Highly Confidential data)
- Rostering and attendance systems
- Payroll and agency labour records
- Learning-management platforms
- Employee credential registers
- Incident and complaint systems
- Occupancy and admissions records
- Finance and procurement systems
Visualization Solution
Care Quality Command Centre
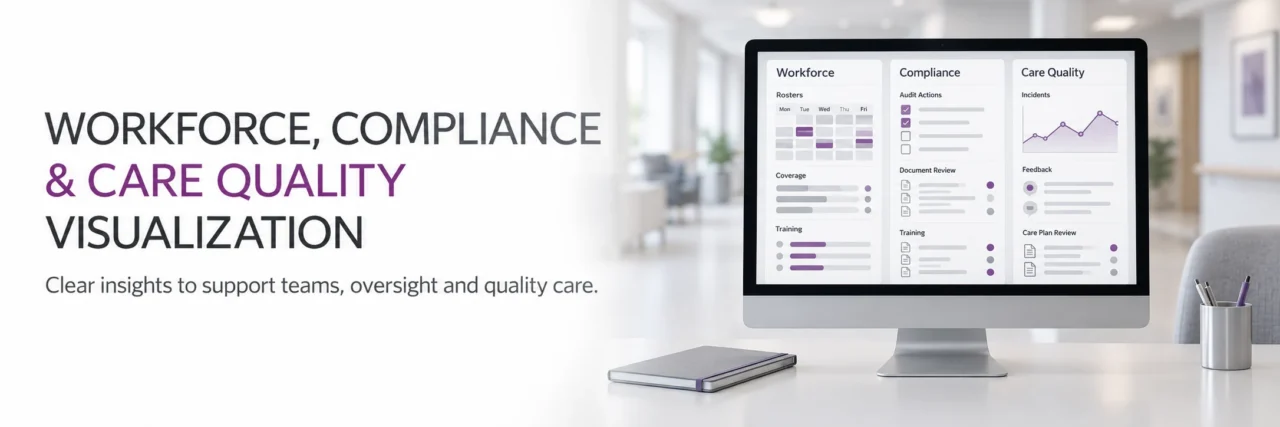
The command centre provided facility and service managers with a prioritized overview of quality risks.
It visualized:
- Falls and fall-related harm
- Medication incidents
- Pressure injuries
- Infections and outbreaks
- Unplanned hospital transfers
- Weight-loss risk
- Behavior-related incidents
- Complaints and feedback
- Open clinical reviews
- Corrective-action status
Rather than presenting raw totals alone, the dashboards used rates and relevant denominators to support fair comparison across facilities of different sizes.
Workforce Coverage Dashboard
The workforce dashboard compared required, rostered, confirmed, and delivered staffing hours.
It provided visibility into:
- Shift coverage
- Skill-mix requirements
- Overtime
- Agency labour usage
- Unplanned absenteeism (Unexpected Medical Leave of Staffs)
- Consecutive shifts
- Roster changes
- Staff-to-care-demand alignment
- Workforce availability by qualification
- Vacant and difficult-to-fill positions
Managers could identify shifts that lacked the required capability before they became operational risks.
Workforce Compliance Dashboard
A credential and training matrix showed the status of:
- Mandatory training
- First-aid and emergency certifications
- Professional registrations
- Police and background checks
- Infection-control training
- Medication competency
- Manual-handling training
- Organization-specific competency assessments
Employees were classified into current, approaching expiry, expired, or incomplete categories. Managers received visual alerts ahead of expiration dates.
Occupancy and Demand Dashboard
The occupancy dashboard enabled management to understand demand by facility, care type, and service area.
It included:
- Available and occupied places
- Occupancy percentage
- Admissions and discharges
- Enquiry-to-admission conversion
- Vacant-day trends
- Care-demand profile
- Home care service volumes
- Referral sources
- Waiting-list movement
- Forecast demand
These insights helped align workforce planning with expected admissions and changing care needs.
Labour Cost and Productivity Dashboard
The financial view connected staffing activity with service delivery and occupancy.
Visualizations covered:
- Labour cost by facility and service
- Overtime cost
- Agency labour cost
- Cost per occupied place
- Cost per delivered home care hour
- Roster variance
- Absence-related costs
- Budget-versus-actual staffing cost
- Productivity by service category
Analytical Features
The solution included:
- Risk-adjusted facility comparisons
- Rolling averages to reduce misleading short-term fluctuations
- Threshold-based alerts
- Trend analysis by week, month, and quarter
- Drill-through to operational records
- Correlation analysis between staffing conditions and quality events
- Forecasting of credential expiries and workforce shortages
The platform did not imply causation based solely on correlation. Instead, it identified patterns requiring clinical or operational investigation.
Illustrative Outcomes
The organization reported:
- Improved visibility into staffing gaps and skill-mix risks
- Reduced reliance on manually maintained compliance spreadsheets
- Earlier renewal of mandatory employee credentials
- Better control of overtime and external labour costs
- Faster identification of recurring clinical risk patterns
- More consistent facility-performance reviews
- Stronger evidence for quality and governance discussions
Strategic Value
The visualization environment allowed leaders to examine care quality, workforce availability, and cost together. This prevented decisions based on isolated measures—for example, reducing labour expenditure without understanding its potential effect on continuity, capability or care quality.